 A very simple scatter plot that shows the effectiveness of practice. A fared in line would show a sharp decline in mistakes with increases in practice. http://ritter.tea.state.tx.us/student.assessment/resources/online/2006/grade8/math/8math.htm
Friday, April 23, 2010
Scatter plot
A very simple scatter plot that shows the effectiveness of practice. A fared in line would show a sharp decline in mistakes with increases in practice. http://ritter.tea.state.tx.us/student.assessment/resources/online/2006/grade8/math/8math.htm

Continuously variable proportional circle map
 This map, shown in four parts, utilizes the same geographical representation and methodology to show the presence of four different types of metal elements in the sediment of river basins in a region of Canada. The variable between the maps are only scale and element depicted.
DOQQ
 The DOQQ is a type of aerial photograph that requires painstaking attention to detail. In this representation of a region of Oklahoma, the image is directly overhead as to prevent as much point of view distortion as possible.
Climograph
 This shows precipitation levels and temps for Honolulu. Being on an tropical island climate with volcanic activity and rain forests it's no wonder the temp is so stable! Though this one shows a time of summer drought. http://www.drought.unl.edu/whatis/climographs.htm
DEM
 This is an illustration of a DEM map of the earth. Utilizing this program, a user can start with the large scale of the earth and zoom in to select and area and access much of the data to be gathered from varied map types.
Windrose
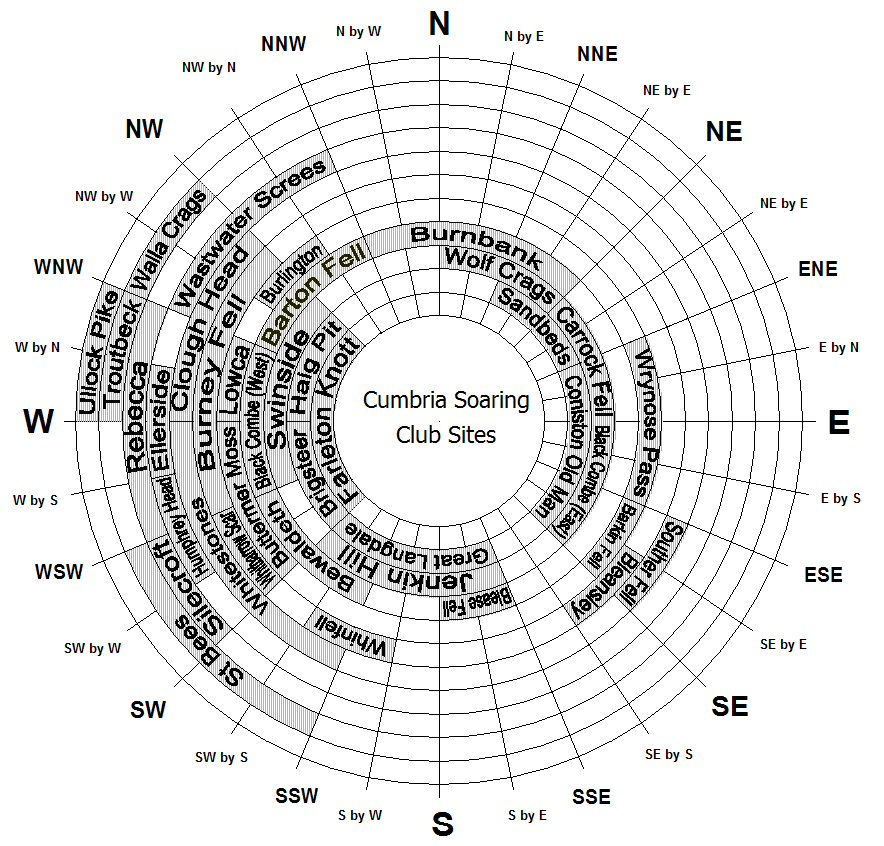 This windrose, utilized by a flying club shows prevailing wind direction based on site. This shows you whether or not you are going to glide into a mountain or a grassy plain. http://www.cumbriasoaringclub.co.uk/SiteManagement/CSC_WindRose.php
Triangular Plot
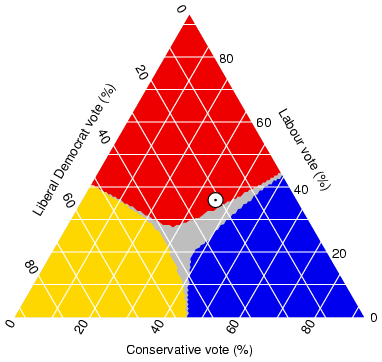
This is potentially one of the more controversial of the maps I have included here. This triangular plot shows a kind of political certainty that no matter how you vote, events will turn out the same. Scary. http://www.ex-parrot.com/~chris/wwwitter/20050407-it_doesnt_matter_how_you_vote_either_way_your_planet_is_doomed.html
Subscribe to:
Posts (Atom)