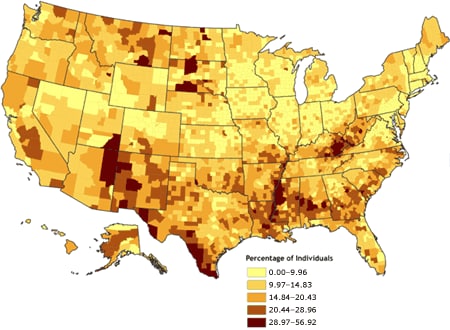
 This map focuses one one thing, poverty. It shows in stark relief the number of people living below the poverty level in this country. It also shows a shape of large amounts of poverty stricken people in the southern part of the country. http://www.cdc.gov/pcd/issues/2007/oct/07_0091.htm
Friday, April 23, 2010
Univariate Choropleth map
This map focuses one one thing, poverty. It shows in stark relief the number of people living below the poverty level in this country. It also shows a shape of large amounts of poverty stricken people in the southern part of the country. http://www.cdc.gov/pcd/issues/2007/oct/07_0091.htm

Bivariate choropleth maps
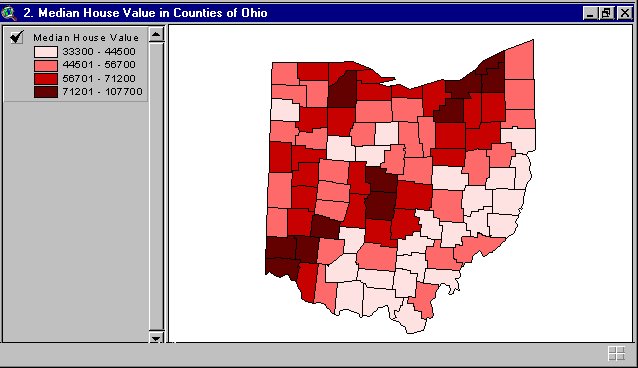 This map utilizes colored shading to depict median home prices in Ohio by county. The twin to this map utilizes the same methodology and geographical region to depict population by county, make the pair "bivariate."
Bilateral Graph

This shows the effectiveness of a bionic ear implant over time. The variants here show side by side the number of correct answers (to a given aural quiz regarding sound localization) given by individuals with the implant over time. http://www.advancedbionics.com/CMS/Your-Journey-to-Hearing/Bilateral-Research.aspx
Unclassed choropleth maps
 Utilizing a more varied degree of shading one color, this map depicts fertility rates for European countries. The country is represented by one average that can be matched by shade to the key to determine approximate number of children per mother.
Classed Choroplelth Maps
 This map uses one color in grouped shading to depict numerical data for a geographical region. In this instance, darker red regions have higher levels of death occurrence in children under one year of age. The lighter the shade of red, the fewer occurrences.
Lorenz Curve
 This Lorenz Curve shows the percentage of the Scottish population at varied income levels. The degree of the curve shows the distance from financial equilibrium. http://www.scotland.gov.uk/Publications/2007/07/18083820/4
Index value plot

This index value plot shows the worth of Disney Stock prices over time (in this case from Sep 1966 through Oct 67). As we can see in 1966 they were still fairly low, but since then have experienced unprecedented growth, followed by one small period of decline, and then further growth. http://www.loricatrade.com/articles/risk-management-investigating-stops/
Range graded proportional circle map
 This map, shown in six parts, depicts six different types of element abundance rates in the same geographical region of Canada. These illustrations also provide a comparison in the source of the minerals between ore and county rocks by using the color of the representative circle.
Scatter plot
 A very simple scatter plot that shows the effectiveness of practice. A fared in line would show a sharp decline in mistakes with increases in practice. http://ritter.tea.state.tx.us/student.assessment/resources/online/2006/grade8/math/8math.htm
Continuously variable proportional circle map
 This map, shown in four parts, utilizes the same geographical representation and methodology to show the presence of four different types of metal elements in the sediment of river basins in a region of Canada. The variable between the maps are only scale and element depicted.
DOQQ
 The DOQQ is a type of aerial photograph that requires painstaking attention to detail. In this representation of a region of Oklahoma, the image is directly overhead as to prevent as much point of view distortion as possible.
Climograph
 This shows precipitation levels and temps for Honolulu. Being on an tropical island climate with volcanic activity and rain forests it's no wonder the temp is so stable! Though this one shows a time of summer drought. http://www.drought.unl.edu/whatis/climographs.htm
DEM
 This is an illustration of a DEM map of the earth. Utilizing this program, a user can start with the large scale of the earth and zoom in to select and area and access much of the data to be gathered from varied map types.
Windrose
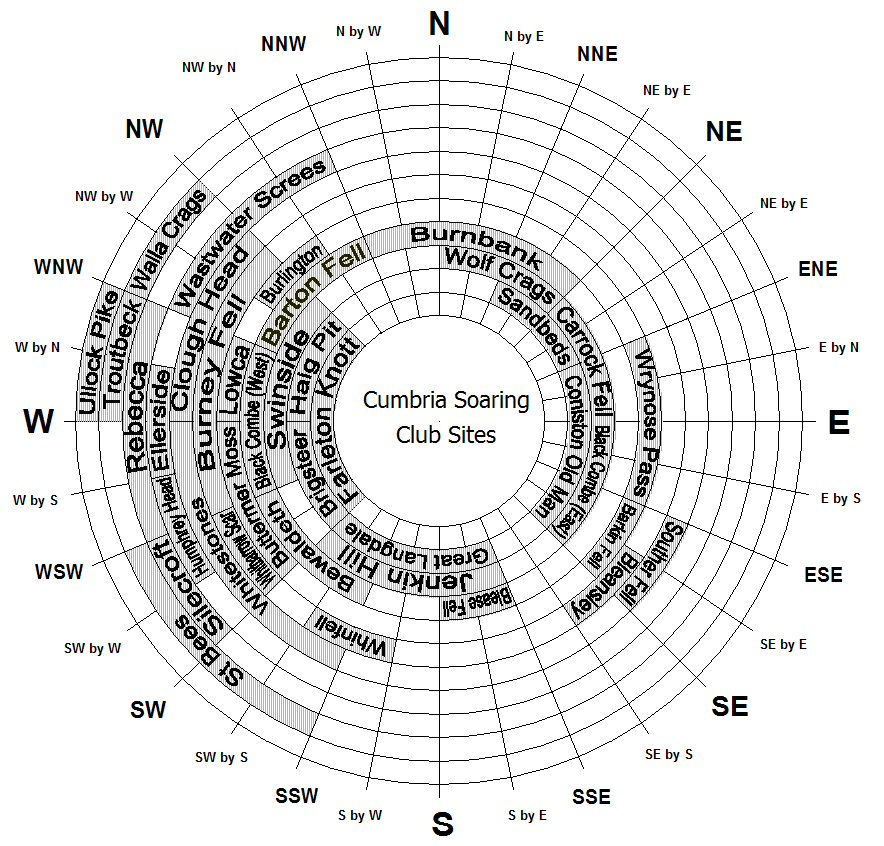 This windrose, utilized by a flying club shows prevailing wind direction based on site. This shows you whether or not you are going to glide into a mountain or a grassy plain. http://www.cumbriasoaringclub.co.uk/SiteManagement/CSC_WindRose.php
Triangular Plot
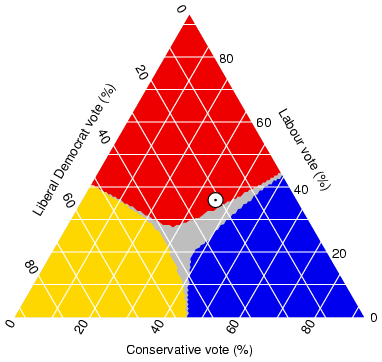
This is potentially one of the more controversial of the maps I have included here. This triangular plot shows a kind of political certainty that no matter how you vote, events will turn out the same. Scary. http://www.ex-parrot.com/~chris/wwwitter/20050407-it_doesnt_matter_how_you_vote_either_way_your_planet_is_doomed.html
Histogram
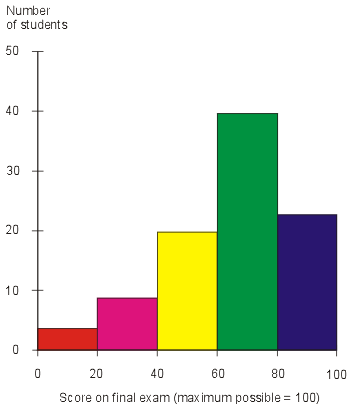 This is a most basic histogram. It shows here a single group and the numbers of people with certain scores on a final exam. Hope I get an A! http://searchsoftwarequality.techtarget.com/sDefinition/0,,sid92_gci330729,00.html
Nautical Chart

Nautical maps provide information regarding the spatial relationships on water with pictorial representations of land masses. This nautical map of the waters off of Cape Cod shows accepted pathways as well as distances in nautical miles.
Box Plot
 This is a box plot showing variation in Ginko Bilboa leaf across time and distance. It uses the error matrix inherant to the box plot to show gradient differences in leafs both modern and ancient. http://www.pnas.org/content/100/12/7141/F5.expansion.html
DLG
 This DLG utilizes shading and colors to represent elevation across the continental United States. Utilizing this methodology, one can tell at a glance elevation differences between Florida and Nevada, for instance.
Star Plot
 This is a pretty neat star plot. It gives a simple correlation device to a user on how different cars compare on different features. This could prove a very useful tool when purchasing the family car.
http://www.itl.nist.gov/div898/handbook/eda/section3/starplot.htm
Subscribe to:
Posts (Atom)