 This map focuses one one thing, poverty. It shows in stark relief the number of people living below the poverty level in this country. It also shows a shape of large amounts of poverty stricken people in the southern part of the country. http://www.cdc.gov/pcd/issues/2007/oct/07_0091.htm
Friday, April 23, 2010
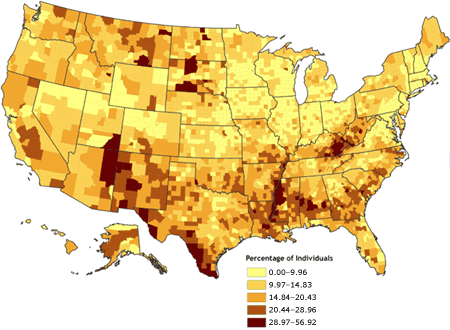
Univariate Choropleth map
This map focuses one one thing, poverty. It shows in stark relief the number of people living below the poverty level in this country. It also shows a shape of large amounts of poverty stricken people in the southern part of the country. http://www.cdc.gov/pcd/issues/2007/oct/07_0091.htm
Bivariate choropleth maps
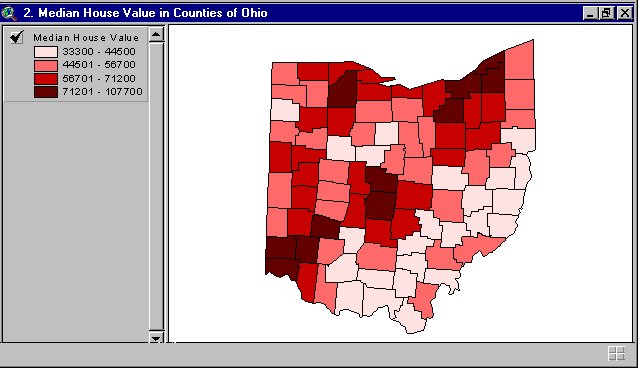 This map utilizes colored shading to depict median home prices in Ohio by county. The twin to this map utilizes the same methodology and geographical region to depict population by county, make the pair "bivariate."
Bilateral Graph

This shows the effectiveness of a bionic ear implant over time. The variants here show side by side the number of correct answers (to a given aural quiz regarding sound localization) given by individuals with the implant over time. http://www.advancedbionics.com/CMS/Your-Journey-to-Hearing/Bilateral-Research.aspx
Unclassed choropleth maps
 Utilizing a more varied degree of shading one color, this map depicts fertility rates for European countries. The country is represented by one average that can be matched by shade to the key to determine approximate number of children per mother.
Classed Choroplelth Maps
 This map uses one color in grouped shading to depict numerical data for a geographical region. In this instance, darker red regions have higher levels of death occurrence in children under one year of age. The lighter the shade of red, the fewer occurrences.
Lorenz Curve
 This Lorenz Curve shows the percentage of the Scottish population at varied income levels. The degree of the curve shows the distance from financial equilibrium. http://www.scotland.gov.uk/Publications/2007/07/18083820/4
Index value plot

This index value plot shows the worth of Disney Stock prices over time (in this case from Sep 1966 through Oct 67). As we can see in 1966 they were still fairly low, but since then have experienced unprecedented growth, followed by one small period of decline, and then further growth. http://www.loricatrade.com/articles/risk-management-investigating-stops/
Range graded proportional circle map
 This map, shown in six parts, depicts six different types of element abundance rates in the same geographical region of Canada. These illustrations also provide a comparison in the source of the minerals between ore and county rocks by using the color of the representative circle.
Scatter plot
 A very simple scatter plot that shows the effectiveness of practice. A fared in line would show a sharp decline in mistakes with increases in practice. http://ritter.tea.state.tx.us/student.assessment/resources/online/2006/grade8/math/8math.htm
Continuously variable proportional circle map
 This map, shown in four parts, utilizes the same geographical representation and methodology to show the presence of four different types of metal elements in the sediment of river basins in a region of Canada. The variable between the maps are only scale and element depicted.
DOQQ
 The DOQQ is a type of aerial photograph that requires painstaking attention to detail. In this representation of a region of Oklahoma, the image is directly overhead as to prevent as much point of view distortion as possible.
Climograph
 This shows precipitation levels and temps for Honolulu. Being on an tropical island climate with volcanic activity and rain forests it's no wonder the temp is so stable! Though this one shows a time of summer drought. http://www.drought.unl.edu/whatis/climographs.htm
DEM
 This is an illustration of a DEM map of the earth. Utilizing this program, a user can start with the large scale of the earth and zoom in to select and area and access much of the data to be gathered from varied map types.
Windrose
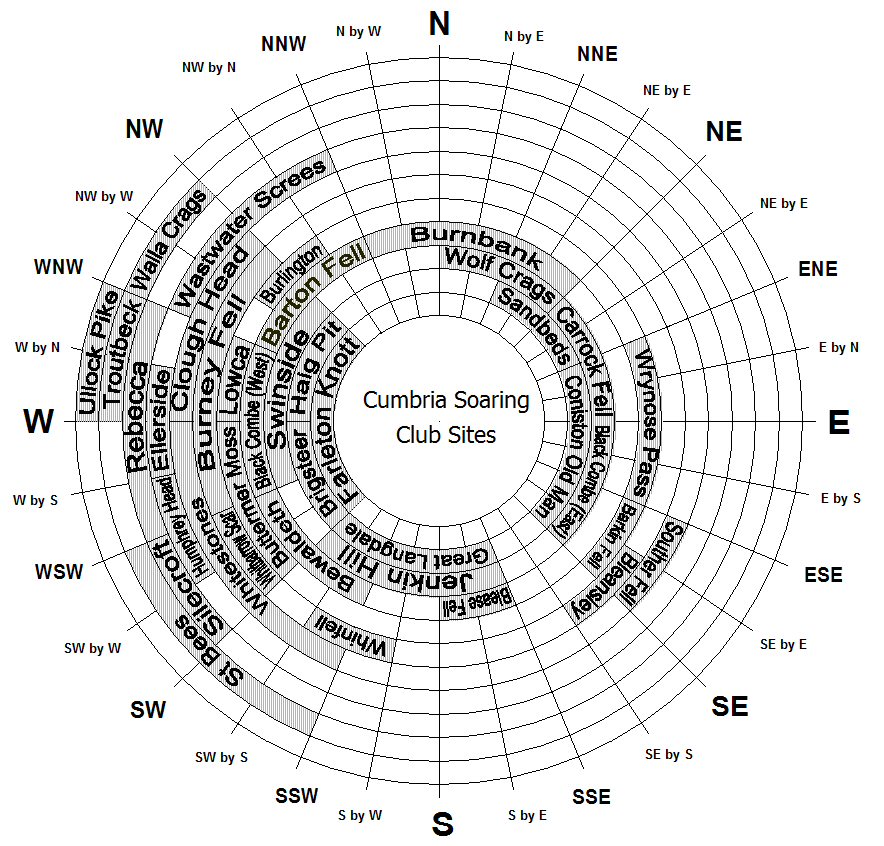 This windrose, utilized by a flying club shows prevailing wind direction based on site. This shows you whether or not you are going to glide into a mountain or a grassy plain. http://www.cumbriasoaringclub.co.uk/SiteManagement/CSC_WindRose.php
Triangular Plot
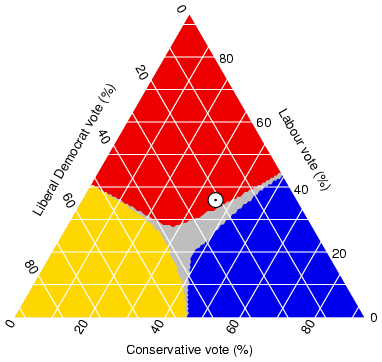
This is potentially one of the more controversial of the maps I have included here. This triangular plot shows a kind of political certainty that no matter how you vote, events will turn out the same. Scary. http://www.ex-parrot.com/~chris/wwwitter/20050407-it_doesnt_matter_how_you_vote_either_way_your_planet_is_doomed.html
Histogram
 This is a most basic histogram. It shows here a single group and the numbers of people with certain scores on a final exam. Hope I get an A! http://searchsoftwarequality.techtarget.com/sDefinition/0,,sid92_gci330729,00.html
Nautical Chart

Nautical maps provide information regarding the spatial relationships on water with pictorial representations of land masses. This nautical map of the waters off of Cape Cod shows accepted pathways as well as distances in nautical miles.
Box Plot
 This is a box plot showing variation in Ginko Bilboa leaf across time and distance. It uses the error matrix inherant to the box plot to show gradient differences in leafs both modern and ancient. http://www.pnas.org/content/100/12/7141/F5.expansion.html
DLG
 This DLG utilizes shading and colors to represent elevation across the continental United States. Utilizing this methodology, one can tell at a glance elevation differences between Florida and Nevada, for instance.
Star Plot
 This is a pretty neat star plot. It gives a simple correlation device to a user on how different cars compare on different features. This could prove a very useful tool when purchasing the family car.
 http://www.itl.nist.gov/div898/handbook/eda/section3/starplot.htm
DRG
 This depiction of DRG utilizes a complex mapping software to show all data relevant to a cargo freight. Including everything from projected routing to competing traffic, this illustration provides all the information at a glance.
Standardized choropleth maps
 HEre we see processed numbers, in this case a population fared in by age. The numbers are extrapolated from the whole of the population. The single color varying by hues works well with this type of map. http://www.statcan.gc.ca/pub/92f0138m/2008003/figures/5200001-eng.htm
Unstandardized choropleth maps
 This choropleth uses unstandardized (read here raw, not averaged or fared.) numbers in it's display. It is simple math and simple display. In this case we see the number of ski shops throughout the area of Michigan, Wisconsin, and Minnesota.
 http://www.uwec.edu/webprojects/geog367/northwoods/silent_sports.html
Isopleths

Investigating the occurrence of Thyroid cancers in the Bryansk Oblast region since the Chernobyl accident, these isopleths depict the surface deposits of contaminates while the circles illustrate the number of documented cases of Thyroid cancers. The isopleths numerically represent the surface deposition densities.
Stem and leaf plot
 This is a very simple Stem and Leaf plot from a site that tells you how to read them. Essentially this correlates numbers on a base and variant system. So for the 259 row, you have 25 and 29 as the actual numbers. http://www.tutornext.com/stem-leaf-plots/927
Isopach
 This isopach depiction of the Barnett Shale is but one of many geological illustrations being used to plan for optimum refinement of natural gas reserves in the Fort Worth Basin of Texas. Using a combination of color shades and numbered lines, this isopach illustrates contours at a scale of 25' for the purposes of planning drill sites.
Isohyets
 The isoheyts here show a natural range of equal points of height. This, as part of a study has direct impact on area rainfall. http://www.fao.org/docrep/009/a0415e/A0415E11.htm
Isotachs
 This map of a North Carolina winter storm shows clear isotachs and wind channels along the low pressure line. The depth of the color of the isotachs shows wind speed and prevailing direction. http://www4.ncsu.edu/~nwsfo/storage/cases/20030123/
Isobars
 Rather than use any old weather map of the US, I chose this one of Australia. This from a website that instructs one how to read weather maps and temperature formations shows a cold front moving in via a low pressure system over south-eastern Australia. The isobars, in that area show a decreasing pressure front which allows the cold air to descend. http://www.hsc.csu.edu.au/primary_ind/prim_ind_240/compulsory/RTE2503A/3264/reading_weather_maps.htm
LIDAR
 Now for something out of this world. This LIDAR image uses a Canadian built imaging system to show us snowfall on Mars. This uses a bivariate matrix to show us time, and altitude.http://www.nasa.gov/mission_pages/phoenix/images/press/Lidar_Fall_Streaks_SD_001.html
Doppler radar
 This is an image many of us are very familiar with. This is tracking Hurricane Charley as it puts a little hurting on Florida. Taken at 1943 local, 2343 UTC, the depth and density of the rain bands is shown in near perfect rotation about the eye. http://www.weatherusa.net/blog/index.php?month=August_2004
Black & white aerial photo
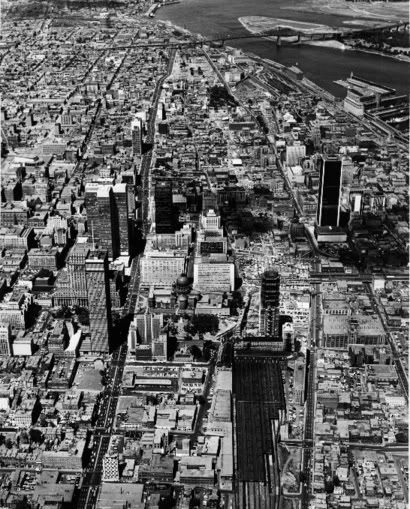 This is a very cool vintage picture of the skyline of Montreal. Taken in 1969 it shows a city that would still look quite modern today. This was part of a pictorial history of the city of Montreal that follows it from a largely church controlled fort to the Montreal of today.
Infrared Aerial photo
 This infrared photo shows a section of Everglades National Park. Outlined in red is the area selected for tests in lightning gaps in mangrove trees. The lush green section is indicative of dense canopy. http://sofia.usgs.gov/publications/fs/2004-3016/
Statistical Map
 This is a statistical map that follows the spread of atheism throughout Europe. This shows in stark relief the predominantly religious countries. It also puts into perspective the largely atheist population of France. http://xenlogic.wordpress.com/2009/04/11/atheism-exposed-pragmatism/
Similarity Matrix

This is a Mastrix devised by TXTGate's designers to show the similarities in protein on humans with and without colon cancer. The correlation is 1.0 for a perfect match (shown in red), and 0.0 for green. http://tomcat.esat.kuleuven.be/txtgate/tutorial.jsp
Cartogram
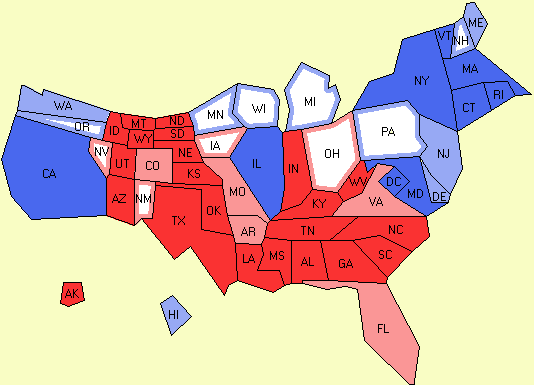 This cartogram utilizes color coding and vague geographical reference to illustrate the distribution of electoral votes in the 2000 Presidential Election. Blue represents strong
 Democratic votes, red strong Republican, with variations between the two.
Flow Maps
 This flow map represents the passage of illegal drugs from South America to the United States. The colors help to specify exactly what this map is focused to convey. For instance, drugs originating in Mexico transported into the US are not included for the purposes of this map.
Isoline Map
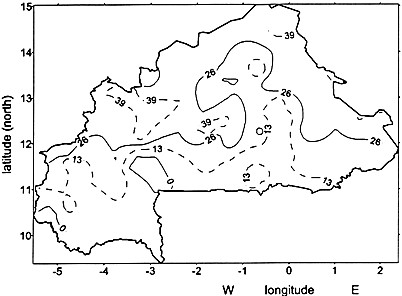 Isoline maps take data from certain points to create generalized regions of the same or similar circumstances, such as this isoline map representing lag time in rainfall for Burkina Faso. The map of the region illustrated here represents actual physical locations as notated by latitude and longitude, while the lines and numbers with represent data gathered rather than political or geographical distinctions.
Proportional Circle Map
 This proportional circle map illustrates the Hispanic Population of the United States. Rather than a cluster of small dots each representing the same number of people, such as in the dot distribution map, this map provides a key in which graduated sizes of circles represent larger numbers of Hispanics to be represented by each circle.
Choropleth maps
 This choropleth map provides a color-coded reference for the primary popular nomenclature for carbonated beverages by county. While state borders are clearly represented by a thick black line, the United States is further divided into counties in order to provide an even more detailed regional representation.
Dot Distribution Map
 Dot distributions maps, such as this representation of the population of the world, can provide a very immediate impression of a concept. The downside of this type of illustration is often that the scale can be so large as to give inaccurate impressions of the facts.
Propaganda Map
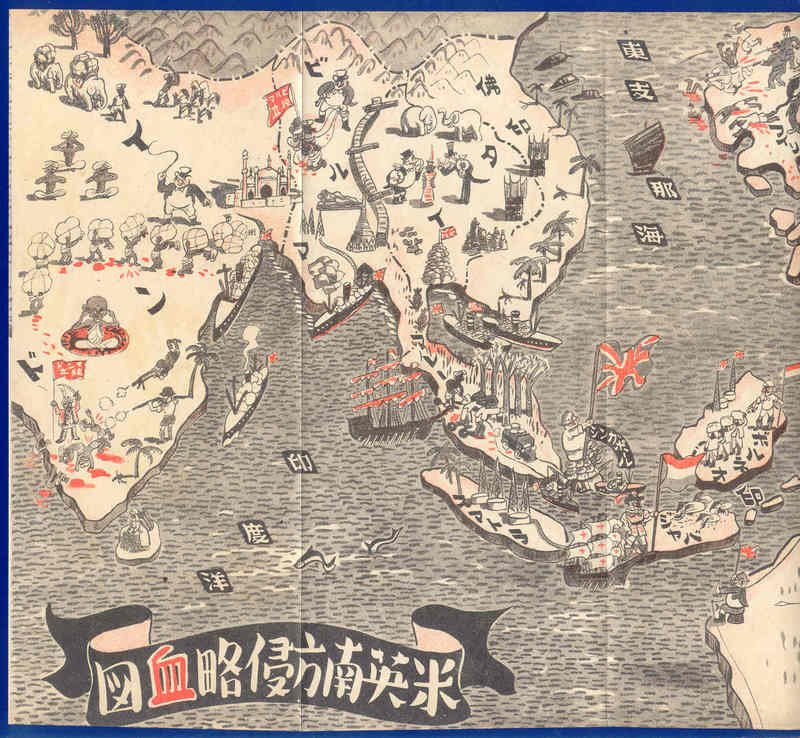 This propaganda map from the Japanese perspectives utilizes generalized landmass representations to establish location while the illustrations provide political commentary on the popular sentiment regarding British Imperial forces. As is the case with most propaganda maps, the social or political commentary is the focus rather than accurate representations of scale.
Hypsometric maps
 This topographic hysometric map illustrates the subsurface geology of the Goiania Metropolitan Region. This map of the capital city of Brazil presents a pictorial reference for the geologic complications that will be encountered in the installation of a much-needed subway system.
PLSS maps
 This is a Land survey that traces the path of a river system through an Idaho Township. It's set up as a sub-divided land survey broken into quadrants. Image obtained from: http://www.idwr.idaho.gov/GeographicInfo/Publications/adjudica.htm
Cadastral maps
 This is a Cadastral map that shows the registered land in the entirety of Taiwan. This shows some very interesting trends. For example there are areas in the lower part of Pingtung County that has very spotty unregistered areas. Adding a topographic or relief map might show us why. Image obtained from: http://www.nlsc.gov.tw/websites/nlsceng/make_page.aspx?la=2&le=2&li=53&sno=152
Thematic Map
 This is a pretty cool Thematic Map. This basically shows the makeup of the plant life of Canada. For those of us who think of snow and ice when the big northern neighbor is mentioned, it's an eye opener. Look at all the green! Compared to the regions of snow and ice, greenery is much more a part of the Canadian Landscape. Image obtained from:http://www.statcan.gc.ca/mgeo/ex2-eng.htm
Topographic Map
 This is a pretty cool rendering of the sea floor between Oahu and Molokai. This isn't just a topographical map of an island, but also it's construction. It shows the physical construction from the sea floor up. Essentially from the earth's crust, this is how these two islands came to be! Image obtained from:http://www.oahunaturetours.com/map.html
Planimetric Map

This is a Planimetric map used to illustrate a parcel of land for sale. It is a very simple map primarily used to show the relationship of the parcel for sale to the nearest major road and its approximate size. This demonstrates the most common use for this type of map. Image obtained from:http://realestate.potlatchcorp.com/idlands/REparcel23.asp
Mental Map
 This is a simple Mental Map of the "Great North Road". As we can see, it is thought that Scotland is just below the North Pole. This depicts a pretty common belief of the state of things even as recent as the 1930's. Image obtained from http://amycutler.wordpress.com/2009/09/15/novel-geographies-of-the-great-north-road-in-c-e-montagues-right-off-the-map-1927-and-elizabeth-bowens-to-the-north-1932/
Subscribe to:
Comments (Atom)