 This map focuses one one thing, poverty. It shows in stark relief the number of people living below the poverty level in this country. It also shows a shape of large amounts of poverty stricken people in the southern part of the country. http://www.cdc.gov/pcd/issues/2007/oct/07_0091.htm
Friday, April 23, 2010
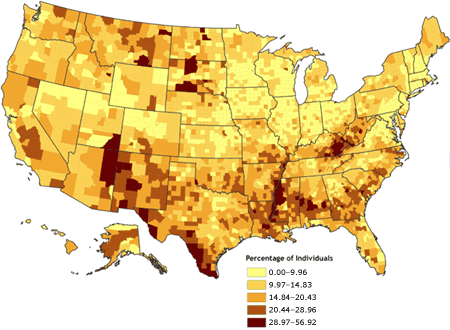
Univariate Choropleth map
This map focuses one one thing, poverty. It shows in stark relief the number of people living below the poverty level in this country. It also shows a shape of large amounts of poverty stricken people in the southern part of the country. http://www.cdc.gov/pcd/issues/2007/oct/07_0091.htm
Bivariate choropleth maps
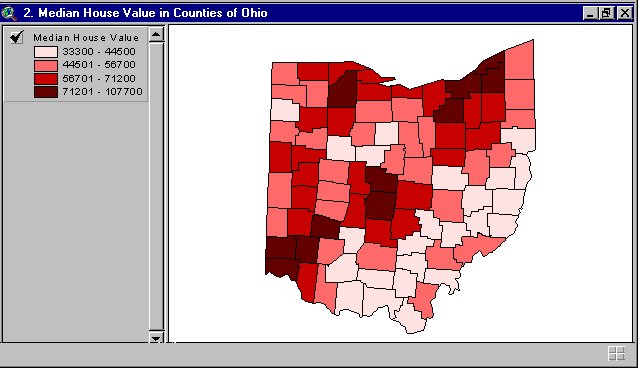 This map utilizes colored shading to depict median home prices in Ohio by county. The twin to this map utilizes the same methodology and geographical region to depict population by county, make the pair "bivariate."
Bilateral Graph

This shows the effectiveness of a bionic ear implant over time. The variants here show side by side the number of correct answers (to a given aural quiz regarding sound localization) given by individuals with the implant over time. http://www.advancedbionics.com/CMS/Your-Journey-to-Hearing/Bilateral-Research.aspx
Unclassed choropleth maps
 Utilizing a more varied degree of shading one color, this map depicts fertility rates for European countries. The country is represented by one average that can be matched by shade to the key to determine approximate number of children per mother.
Classed Choroplelth Maps
 This map uses one color in grouped shading to depict numerical data for a geographical region. In this instance, darker red regions have higher levels of death occurrence in children under one year of age. The lighter the shade of red, the fewer occurrences.
Lorenz Curve
 This Lorenz Curve shows the percentage of the Scottish population at varied income levels. The degree of the curve shows the distance from financial equilibrium. http://www.scotland.gov.uk/Publications/2007/07/18083820/4
Index value plot

This index value plot shows the worth of Disney Stock prices over time (in this case from Sep 1966 through Oct 67). As we can see in 1966 they were still fairly low, but since then have experienced unprecedented growth, followed by one small period of decline, and then further growth. http://www.loricatrade.com/articles/risk-management-investigating-stops/
Subscribe to:
Posts (Atom)